Find Last Row and Last Column of Contiguous Data Range in Excel
How to Find the Bottom-Right Cell in a Data Range
You can usually assume where the data in any given spreadsheet is going to start: cell A1. Even if the formatting of a particular spreadsheet has the data starting in a cell that is not cell A1, that top-left cell should be the same every time. The row-count and column-count, however, can be variable. More often it’s the row count that changes, but the column count can change too. For this reason, I like to programmatically look for the last cell (the bottom-right cell) of a data range.
Once you have the top-left and bottom-right cells, you have a map to the entire data range on any given Excel spreadsheet and you can do whatever you want. The image below illustrates what I mean. The top-left cell is quadrant 1 and the bottom-right cell is quadrant 2:
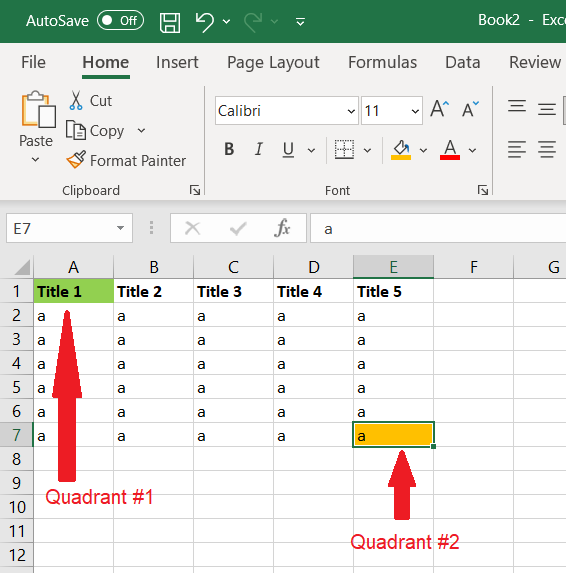
The code example below assumes you know the cell address of quadrant 1, in this example A1. The code finds and returns the column and row numbers of quadrant 2.
Explanation of code sample
The code below illustrates how to define the last row and last column of a contiguous data range, then it loops by row and highlights even-numbered rows.
Option Explicit

'get_full_range_vba_excel
'assumes the data range starts at cell A1
'it doesn't matter how many rows down or columns across, you'll get the last row / column of data

Sub LoopThroughRange()


Dim ws As Worksheet
Dim i As Integer
Dim lRow As Long    'variable for last row in continguous range
Dim lCol As Long    'variable for last column in contiguous range


'define worksheet object variable
Set ws = ThisWorkbook.Worksheets("Sheet1")


'find last row
lRow = ws.Range("A" & ws.Rows.Count).End(xlUp).Row


'find last column
lCol = ws.Cells(1, ws.Columns.Count).End(xlToLeft).Column

'At this point, you now have your data range
'A1 to whatever your last column and last row of contiguous data is

'loop through range by rows and highlight even rows yellow
For i = 2 To lRow
    If i Mod 2 = 0 Then 'check if even numbered row
        ws.Range(ws.Cells(i, 1), ws.Cells(i, lCol)).Interior.ColorIndex = 6    'highlight yellow
    End If
Next i


'lets us know the program is finished
MsgBox "Finished"


End Sub
Here is the finished product of the code:
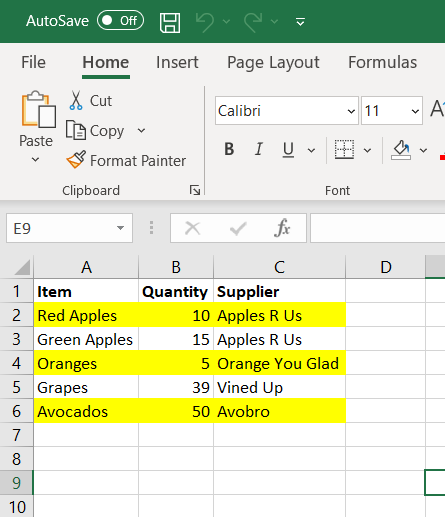
You’ll noticed I didn’t highlight the entire row that goes beyond the data range. The code only highlights a row until it’s last column, giving a cleaner presentation. I was able to do this because I took the time to find the last column in the contiguous data range. The possibilities are endless once you’ve mapped and defined a data range. You could loop through each cell by row and column, and apply formatting or value changes based on each value you come across.
Give it a try and see what else you can do!